AN-005 · application note · systems
CUDA Performance, Part 1: Device Busy Is Not GPU Busy
A program can report 98.8% device utilization while leaving its compute units idle 39% of the time. This is what I learned building a TUI for nsys timelines, and why the second number is the only one that matters.
- published
- length
- 11 min·2,232 words
- application
- systems/performance
- terms
- cuda, gpu, profiling, nsys, tooling, performance
One of my programs reported the device busy 98.8% of the time. Its compute units were idle for 39% of that same run.
Both numbers were correct. That contradiction is the first thing worth unlearning about GPU profiling, and it took me a while to accept that the reassuring number was the useless one.
Memory copies don’t run on the SMs. They run on the copy engines, which are separate silicon. So “device busy” happily counts a DMA transfer as the device doing work, and a program that spends its life shuffling bytes back and forth will look magnificent right up until you ask what the compute units were doing.
timeline_demo:  device busy 98.8%   <- looks perfect
                SMs idle    39.1%   <- the truth
Only the second number tells you where the wall clock went. Everything below is about that second number.
§Why I built a TUI for this
nsys is a tracer. It timestamps events — kernel launches, memory copies,
synchronisation — and it never reads hardware counters for a kernel. So it can tell you
that your GPU sat idle for 4 ms and what was happening on the device while it did, but it
cannot tell you anything about what happened inside a launch.
That division is cleaner than it sounds, and it means the timeline answers exactly one question: where did the wall clock go, and what could have filled it?
I wanted that question answered in a terminal, quickly, with the gaps ranked rather than
buried. So I wrote gtools, a small TUI viewer
over nsys reports. Everything in this post came out of two commands:
gtools nsysview -focus gpu -view summary,timeline,gaps <report>.nsys-rep
gtools nsysview -focus gpu -from 7ms -to 13.2ms -view gaps <report>.nsys-rep
The -focus gpu matters more than it looks. Without it, CUDA context creation — a large,
one-off cost at startup — dominates every percentage in the summary, and you end up
reading statistics about your process launching rather than about your program running.
Here is what the first of those commands prints for timeline_demo, and it contains the
contradiction from the top of this post in two adjacent rows:
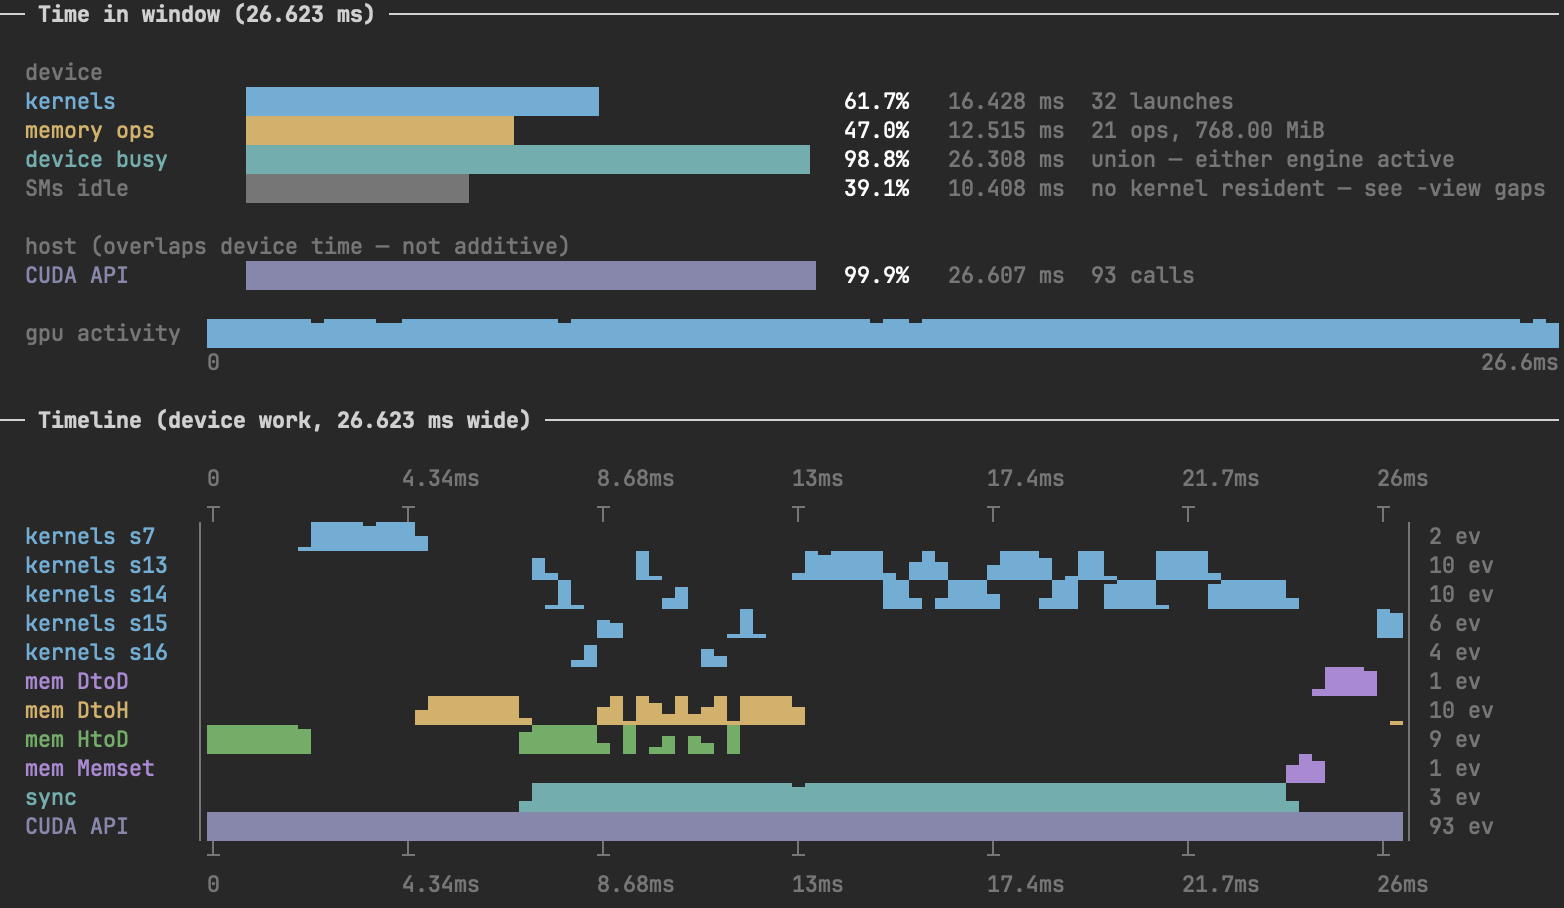
Figure 1: timeline_demo — device busy 98.8%, SMs idle 39.1%, sitting one line apart. The lower panel splits device work into per-stream kernel lanes and memory lanes.
Read the top block downwards. device busy is the union of both engines, so a memory
copy keeps it high. SMs idle is the row that tells you no kernel was resident, and the
two disagree by a wide margin here.
(kernels 61.7% and the SM busy 60.9% I quote later are two different measurements:
the first is kernel-lane occupancy, which counts overlapping kernels, and the second is
simply 100% − SMs idle.)
§Two programs, same work, very different lives
I profiled two demo programs against each other. Both run on the same machine, both move exactly 768 MiB, and both compute the same thing.
timeline_demo | gap_demo | |
|---|---|---|
| wall clock | 26.62 ms | 41.20 ms |
| bytes moved | 768 MiB | 768 MiB |
| kernel launches | 32 | 4,014 |
| CUDA API calls | 93 | 8,068 |
| SM busy | 60.9% | 30.9% |
| SM idle — copy only | 37.9% | 32.5% |
| SM idle — fully idle | 1.2% | 36.7% |
| copy hidden behind compute | 19.4% | 0.0% |
| recoverable by scheduling | 1.14× | 2.02× |
Same work, same bytes, 1.55× the wall clock.
The two idle rows are nearly mirror images, and they’re the interesting part.
timeline_demo wastes its time on transfers. gap_demo wastes time on transfers and on
doing nothing whatsoever — over a third of its runtime, the GPU has an empty queue.
You can see that second failure without reading a single number:
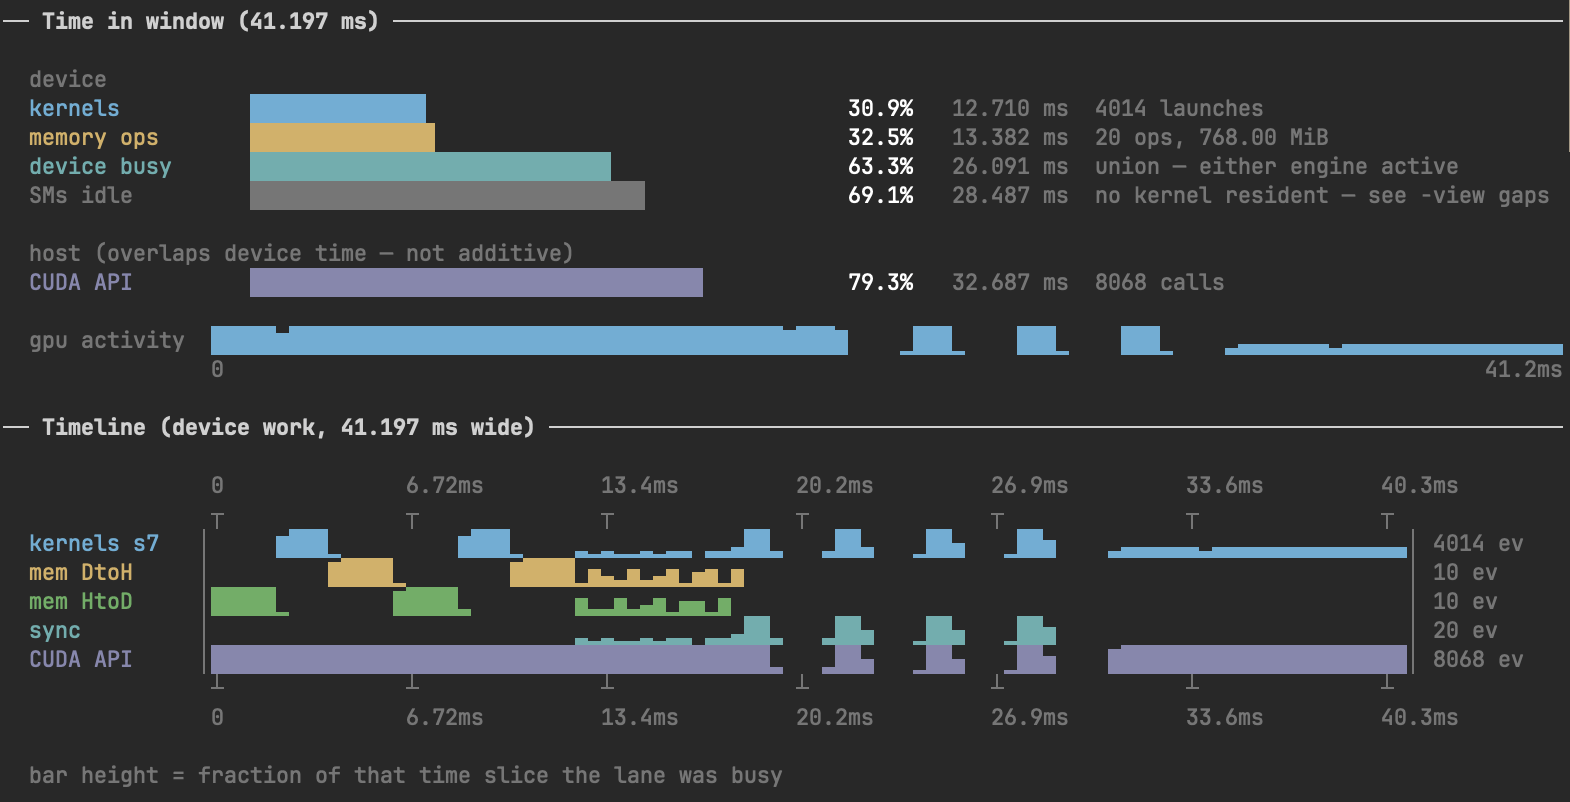
Figure 2: gap_demo — same 768 MiB, same work, 41.197 ms. The gaps in the gpu activity strip are the 36.7% of runtime where nothing at all is resident.
Compare the gpu activity strip against Figure 1. timeline_demo is a near-solid bar.
gap_demo breaks into islands with dead air between them, and the four narrow spikes past
20 ms are a phase launching 4,000 tiny kernels that the CPU cannot feed fast enough.
The single most damning number, though, is copy hidden 0.0%. Not one byte of
gap_demo’s 768 MiB moved while a kernel was running. Every transfer stopped the world.
§The demo labelled “efficient” isn’t, mostly
Here’s where whole-program numbers start lying to you.
timeline_demo is 60.9% SM busy overall. That average is made of four phases with
completely different problems, and once you split them apart the diagnosis stops being
ambiguous:
| phase | span | kernel | copy | SM busy | hidden | floor | speedup | verdict |
|---|---|---|---|---|---|---|---|---|
| A serial | 7.02 ms | 2.41 ms | 4.51 ms | 34.3% | 0.0% | 4.51 ms | 1.56× | serial staircase, real waste |
| B pipelined | 6.19 ms | 2.42 ms | 6.13 ms | 39.1% | 39.5% | 6.13 ms | 1.01× | already optimal |
| C variety | 10.93 ms | 10.84 ms | — | 99.2% | — | 10.84 ms | 1.01× | already optimal |
| D reduce | 2.49 ms | 0.54 ms | 1.87 ms | 21.8% | 0.0% | 1.87 ms | 1.33× | memset and D2D exposed |
(floor is max(kernel, copy) — the wall clock that phase would take with perfect
overlap and no other change.)
Look at phases B and C. One is 39% SM busy, the other is 99% SM busy, and both are already optimal. If you had judged either one on its utilization number alone you’d have reached the opposite conclusion about phase B.
That’s the rule that fell out of this: judge regions, not files. A program is not fast or slow. It has phases, and they usually fail in different ways.
§When a low number isn’t a problem
Phase B is worth sitting with, because it’s the case that will waste your afternoon.
Pipelining worked there. Copy-hidden went from 0.0% in phase A to 39.5% in phase B, on identical work and identical bytes. And the phase is still only 39% SM busy. No amount of additional streams will improve it:
copy    6.13 ms
kernel  2.42 ms      copy engines busy 99.1% of the phase
You cannot hide 6.13 ms of transfer behind 2.42 ms of compute. The copy engines are saturated — they’re the bottleneck, and they’re already flat out. The phase runs in 6.19 ms against a floor of 6.13 ms, which puts it at 99% of optimal.
So before optimising anything, check the ratio:
copy > kernelmeans you’re transfer-bound. Overlap buys you at mostcopy/span, and the real fix is arithmetic intensity or moving fewer bytes — keep data resident, fuse kernels, drop precision.copy < kernelwith SM busy still low means you have a genuine scheduling bug. Overlap it.
Phase B is the first case. Phase A of the very same program is the second. They sit 7 ms apart and want opposite fixes.
§The one that looks pipelined and isn’t
Now the finding I actually enjoyed.
gap_demo has a phase with the same chunk count as timeline_demo’s phase B, the same
16 MiB pieces, and visibly the same intent. It hides 0.0% of its transfers.
The entire difference is two lines:
cudaMemcpy(...);            // blocking, and on the default stream
cudaDeviceSynchronize();    // host round-trip, once per chunk
Chunking without cudaMemcpyAsync and per-chunk streams is just the unchunked version
executed eight times. The code has all the shape of a pipeline and none of the
behaviour.
The timeline is the only thing that tells you the difference. The source looks right in both cases. You can read that function carefully, agree that it chunks the transfer, and be completely wrong about what the hardware does with it.
Its signature in the gaps view is a regular sawtooth of small gaps, each holding one small transfer — visibly different from the few large gaps a single blocking copy leaves behind.
§What each failure looks like
After enough of these, the shapes start naming themselves. This is the table I actually use:
what you see in gaps | cause | fix |
|---|---|---|
| few gaps, ms-scale, “device was doing: HtoD/DtoH 128 MiB” | blocking transfer, nothing overlapped | cudaMemcpyAsync plus chunks on streams |
| regular sawtooth of µs–ms gaps, each a small transfer | chunked but synchronised per chunk | drop the per-chunk sync, one stream per chunk |
| a few ms-scale gaps showing “— nothing”, between kernels of the same name | host work or sync between launches | queue launches ahead |
| thousands of µs-scale gaps showing “— nothing” | launch latency, kernel too small | fewer, bigger launches; check waves |
| copy hidden is high, SM busy still low | transfer-bound at the ceiling | reduce bytes or raise arithmetic intensity |
| no gaps at all | compute-bound | the timeline has nothing left to say |
Two signals outside the gaps view corroborate all of this.
The CUDA API call count. 93 against 8,068, for identical work. That table is host-side: every row is one call your CPU made into libcudart, and the duration is how long the CPU sat inside it. It’s CPU time, not GPU time, which is exactly why it catches this.
gap_demo’s worst phase makes the arithmetic explicit:
| side | work | median | issued every |
|---|---|---|---|
| host | cudaLaunchKernel | 2.336 µs | 2.512 µs |
| GPU | the kernel itself | 832 ns |
The GPU drains the queue three times faster than the CPU can fill it. 3,865 launches at 2.5 µs each is 9.7 ms of CPU time spent writing orders, to cover 3.3 ms of actual work. The GPU spends 72% of that phase waiting to be told what to do.
waves in the kernels table. That same kernel reports waves 0.00 — one block on 48
SMs. Even with zero gaps it would waste 47 of the 48.
§Four ways the timeline will mislead you
Columns lie about concurrency. Each column of a rendered timeline is a slice of wall
clock. 26.6 ms across ~90 columns is roughly 290 µs per column, so two kernels launched
100 µs apart appear simultaneous. timeline_demo looks like it’s overlapping two streams
beautifully; the real figure is 212 µs of genuine two-kernel residency, which is 0.8% of
the window. Zoom before believing.
Big kernels can’t overlap anyway. A waves figure of 455 means one launch fills the
GPU 455 times over. There’s no room for a second kernel, so stream concurrency has nothing
to offer. It only helps when waves is at or below about 1 — which is also, awkwardly, the
regime where your grid is too small.
Async launch is not concurrent execution. Every launch returns immediately. That is a statement about the host, not the device. Two kernels actually running at once requires separate streams.
sync on its own is not a problem. A long sync bar with dense kernel lanes underneath
means the CPU ran ahead and is now waiting, which is exactly what you want. A long sync bar
with empty kernel lanes is the failure.
§The order I read them in
-focus gpu, or context creation swamps everything.- SM idle in the summary. One number, and it decides whether to keep going.
- The gaps view, and specifically the two-way split: copy-only versus fully-idle. That picks which half of the signature table applies.
- The
largest gap:line — it names the gap, its size, and what filled it. - The kernel-versus-copy ratio, before optimising anything. Compute the floor as
max(kernel, copy)and find out how much is genuinely on the table. - Split by phase, using the
t+offsets from the gap table. - Kernel durations — last, not first.
That last point is the one I’d have got wrong a year ago. Kernel duration is the most visible number in any profile and the least useful place to start, because a kernel that takes 3 ms inside a program that spends 12 ms doing nothing is not your problem yet.
§Where this left the two programs
Neither program is “the efficient one”. The efficient thing is phase C of
timeline_demo: 99.2% SM busy, 12 launches, two streams, and zero transfers, because the
data was already resident on the device.
That’s the target shape, and the useful part is that it was already sitting in a file I had. Load once, keep it resident, fuse the passes, launch few and large, synchronise once at the end.
The distance to it:
timeline_demohas 1.14× available from scheduling alone. It’s nearly done; what remains is data movement volume, not overlap.gap_demohas 2.02× available from scheduling alone, before touching a single line of kernel code.
Neither of those numbers required understanding what any kernel computes.
§The tool
gtools is on GitHub: github.com/akurniawan/gtools.
It reads an existing .nsys-rep — there is nothing to instrument and no re-run required,
so you can point it at a profile you captured months ago. The three views used throughout
this post are summary, timeline and gaps:
gtools nsysview -focus gpu -view summary,timeline,gaps report.nsys-rep   # the whole picture
gtools nsysview -focus gpu -view gaps report.nsys-rep                    # ranked gaps only
gtools nsysview -focus gpu -from 7ms -to 13.2ms -view gaps report.nsys-rep  # one phase
Issues and pull requests are welcome, particularly around the gap signature table — it is built from the failure modes I have hit, which is not the same as all of them.
§Next
The last row of the signature table — no gaps at all — is where the timeline runs out of things to say, and every remaining cost is inside a launch.
Part 2 goes one level down, into what happens inside one: a question about whether copying data to the device is worth it on this hardware, which turned into a 12× performance cliff and two very plausible explanations that both turned out to be wrong.